
The monograph below is the origin story of RMT. It’s written for researchers and others interested in the sciences of the mind. You can see how our passion for figuring out the Rubik’s Cube of how ads and contexts can be aligned for optimal performance led to a census of the English language, and the decoding of the video genome, the discovery of the very drivers of human viewing behavior.
Discovery and Application of the Video Genome
Bill Harvey, Chairman, RMT ScreenSavants and Bryan Mu, Vice President, Research & Analytics, NBCU Cable Entertainment, UCP
Precis
A systematic process found 265 metatags that substantially shape viewing behavior to television and motion pictures. This page reports the story of that discovery, its validation, and how the data are being applied today.
Background
In the beginning, storytellers sat in the firelight and entertained their audiences face to face. The feedback was instantaneous and visceral to the storyteller, he or she got most of the signal from the audience, with very little noise. Fast forward to the 21st Century, where people who create screenplays for features or for video, receive feedback in the form of box office and Nielsen statistics, dial tests and other data tables which replace the audience’s direct reactions.
The information collected and reported, and the much smaller quantity of that data which actually gets attention, is currently focused on the need to add some form of objectivity to the decision to go or not go. There is not a great emphasis on giving feedback that might help the creatives dream up even more of what works on a given theme or in a given character. The latter is “termed” prescriptive with extreme negative connotation.
As a result, of the estimated $230 billion invested in the creation of screen content annually, the percentage of properties reaching profitability as a percentage of properties started is extremely low. For example, in the case of series television, only about ~20% of concepts become pilots, only about ~20% of pilots become series, only ~33% of first season shows make it to a second season. The percentage of pilots that reach profitability (five years on network to create enough episodes for syndication) is under 2%1. As a benchmark, 40% of the tests of heavying up a television advertising campaign behind a specific TV commercial (also content) more than pay back the incremental media costs with sales2.
We might say that the higher predictability of advertising results as compared with entertainment results is a reflection of the historically greater use of data in advertising than in entertainment. Many would question this view out of a correct understanding that creativity transcends data. However the writers can envision a plausible scenario in which creatives, instead of being given report cards, are given audience reactions in a form highly digestible to creatives, such as in the language they use when they think about storytelling. With the right execution of measurement and reporting for the particular circumstances, why could not creativity and science harmonize effectively?
Objectives
- Understand what drives viewing Transcend simple reporting of who watched what, and learn why they watched it. Codify this as science.
- Be able to delight the average human being by increasing his or her viewing pleasure through the recommendation of fare personalized to the user’s deepest viewing motivations.
- Have creatives hungry for the stimulation they receive from audience feedback digested into thought starters, e. clumsy examples of efforts to do the writer’s job.
- Optimize advertising by having the metatags of the ad and the program environment in TiVo Research has reported that the creative is 65% of the ROI lift effect of using direct-match singlesource at scale3. In order to optimize creative, one must have levers to pull. Value Signals are the first levers for creative the industry has ever had. Value Signals are analogous to the Human Genome and the Mendeleev Table of the Elements in exposing hidden structure. These are the hidden structures that motivate what people watch.
- Help media executives make decisions by adding the dimension of Lead-in/lead-out scheduling and tune-in placement decisions, etc.
- Recalibrate the metatags for each culture.
- Validate at each stage of the objectives.
History
In the 1970s, Harvey and Dr. Timothy Joyce worked on several experimental projects around Harvey’s concepts of “psychographics that matter”. Over 10,000 words were systematically drawn from the Oxford dictionary and used in national self-scaling surveys. Factor analysis reduced the mass of data to 20 psychographic questions still used to this day in one of the leading syndicated services in the world, MRI.
Harvey used about 1000 of these words along with others developed in the research connected with the launch of many new cable networks in the 1980s to compile a list of ~1500 words describing people, content (e.g. programs/movies), human values, emotions, moods, and situations. These words had inductively risen to attention in the course of research including open end questions.
In the 1990s Harvey’s company Next Century Media (NCM) did three things for the first time: (a) addressable commercials (b) set top box data to research grade (c) data driven program recommender. These software solutions were partially deployed and tested with four leading MVPDs and then used by a fifth MVPD to analyze the Aurora addressable trial.
In the preferred implementation, the viewer would hit the remote’s “A” button to receive a recommendation for the next time period. For example, if at 8:55PM a viewer were to hit the button, he or she would receive one most recommended show starting at 9PM. The system would look back at all the set top box data, at the shows this set top box had watched, and the metatags that NCM’s experts had attributed to those shows. It would then eliminate all shows starting at 9PM that the set top box had viewed for at least 10 minutes in the past, and make a best match of weighted metatags between the subject’s profile and the choices at 9PM. The viewer could then hit the “B” button to applaud the recommendation or the “C” button to boo the recommendation. In tests, applause ran more than 90% over boo.
In the course of the 1990s work it was seen that of the ~1500 metatags, only 265 of them had high predictivity that the viewer would become loyal to the recommended show. This was corroborated independently by set top box data and by an online interactive questionnaire which used the concept of “accelerated time”. The viewer was given a roster of programs/movies and asked to rate on probability of viewing. Those assigned higher probabilities were inspected for their metatags. The next roster shown was loaded with programs having those metatags. In test after test, the scores were seen to go up on every pass. Eventually a viewer would exhaust all the shows in our test that could possibly satisfy him or her and then the scores would hit a ceiling and begin to go down.
Figure 1

The Experimental Procedure

Exhausting Available Positives
Validation
More recently the 265 Value Signals were re-validated as predictive of Nielsen ratings, and conversely of series cancellations.
In the first study, the evidence was arrayed heuristically. In Figure 2 you see a number of Value Signals arrayed down the vertical, while across the horizontal the failed and cancelled shows are to the left and the successful, high rated and not cancelled shows are to the right. The eye can see that there is more density of the Orange Value Signals in the upper left and conversely higher density of green tags in the lower right. This means the orange tags are negative drivers to the success of a sitcom, and the green tags are positive drivers to the success of a sitcom. (The actual Value Signals are not shown, instead showing anonymizing handles on the Value Signals themselves.)
Figure 2

Failure vs. Success Drivers
One can see in this graphic that the upper left hand quadrant is most densely covered in orange (negative Value Signals), correctly predicting that these shows would be cancelled. The green is most dense in the lower right hand quadrant, the happy land of the successful shows, where the positive Value Signals again correctly predicted and explained the actual results.
In the next study we moved to the use of the metric “Adjusted R Square”. This is the percentage of variance accounted for in some dependent variable, in this case being the Nielsen Live+7 day household rating. The household rating accounts for 85% of the variance in the people ratings and is passively collected, hence its choice as the most robust “payoff measure” against which to scientifically measure other measures.4
“R” is the coefficient of correlation. For example, a top agency found that TiVo Research had a .9533 correlation with Nielsen ratings.5 “R Squared” is “R times itself” so in the latter example the R Squared is .9533 times .9533 which equals .8663. R Squared is obviously a tougher test, a higher bar, than R. A still higher bar is the metric “Adjusted R Squared” which is adjusted to discount R Squared based on how many variables it uses. Adjusted R Squared is the most rigorous test and so is the one we chose.
Metrics of the Context
In evaluating any new metric, it is appropriate to use the same yardsticks to also appraise the other metrics which practitioners have already been using. Research Measurement Technologies (RMT), the company acquiring NCM’s metatags and renaming the key 265 Value Signals, carried out two surveys with Vision Critical’s national U.S. panel. The first, conducted November 4-7, 2014 measured 40 new series using the standard intent to view question and the standard quality rating question used by most practitioners. Trailers were the stimuli in that wave and in a second wave February 18- 20, 2015 which measured 22 additional new series. Each of the two waves had intab samples of 300 respondents. In the second wave the Vision Critical second by second tool called Media Impact was used as a sort of a textured “dial” to get second by second reactions to the stimuli. Ten different buttons allowed the collection of reactions along ten different dimensions. In normative practice today, one is using a slider or dial that measures a single dimension, representing enjoyment, which was one of the buttons (“Enjoying It”) used in the second wave.
It therefore became possible to compare directly the Adjusted R Squared of Value Signalss with the dial, intent to view, and quality rating scales used today. Those results are as follows for all shows used in the second wave study just described.
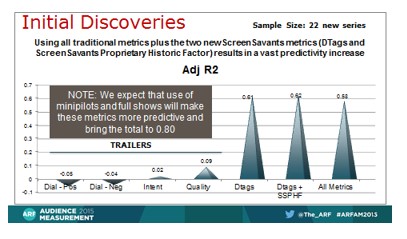
Increased predictivity of currency
Note the extremely low predictivity of the conventional metrics. However, this could be accounted for by a number of factors, including:
- Because the stimuli were trailers (typically 2 minutes or less) and cherrypicked to include the best scenes and cuts, the range in scores in the survey metrics were relatively tightly clustered, unlike the range in the currency ratings which fell across a far wider range. Specifically, the highest value on the survey metrics was from 2.8X to 4.7X the lowest value depending on which of the four metrics one chooses, indicating a truncated range of mostly high values due to the cherrypicking. By stark contrast, in the Nielsen ratings being predicted, the highest rating was 64.4X the lowest rating for these same 22 shows.
- These 22 programs have in most cases just recently launched and the currency ratings used in the analysis may yet to have stabilized.
We expect that as more data are collected, we will see that the traditional metrics of dial, intent and quality will emerge as having their own significant value as predictors, when at least 8 minute samples are tested, that are more actual stories and less sizzle reel of top moments. We predict that .80 Adjusted R Squared will be achieved on samples of over 100 series once this combination of traditional with ScreenSavants metrics is fully implemented.
The next analysis combined the sample sizes of all series for which Value Signals, Historic Factors, and published currency ratings were available, for a reappraisal with more stable sample, but now lacking the dial, intent, and respondent perceived quality metrics.
Practitioners use variations on the theme of “recent historic rating averages enjoyed by the network that later carries the specific program, in the specific time period and day where that program will appear”, as a predictor. ScreenSavants has its own variation on this metric, called the ScreenSavants Proprietary Historic Factor (Historic Factor for short), with proprietary aspects felt to increase predictive power. Here, then, for the largest sample of shows possible to date, is a comparison of Value Signals with the Historic Factor.
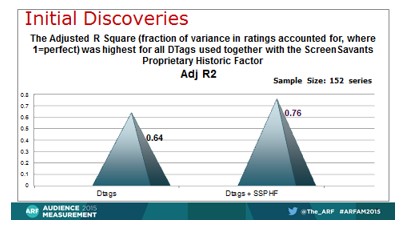
76% predictivity before survey
The Value Signals on their own, without any survey measures, attain .64 Adjusted R Squared (a correlation of 0.80). This is on a very large sample of 152 shows, approximately the top 150 series. When the Historic Factor is added to the Value Signals, this brings the 0.64 up to 0.76 (a correlation of 0.872). These high degrees of predictivity of currency are unprecedented.
This suggests that as the industry continues its evolution, the use of all of the traditional and new metrics including the Value Signals will cause an increase in the predictivity of ratings. When 8 minute or longer actual samples of what a series will be to experience are used with the traditional metrics, we expect to see that the dial, intent, and quality rating scores have significant predictivity they will add to the Value Signals and Historic Factor. An expectation of 0.80 Adjusted R Squared is not unreasonable. For samples of up to 78 shows each we have seen 0.86 without survey measures.
Tests with Real World Creatives
In September-December, 2014, NBCU conducted a series of three tests with ScreenSavants, and a different network conducted a fourth test. In all four cases, feedback was given to the creatives, with the intention to:
- Break the mold of the old “research versus creatives” box
- Walk dangerously close to being prescriptive without falling into that category
- Provide insights that the creatives would take to heart
- See if this had a noticeable effect on the direction of the property
It was realized that this was too early a test to yield actual ROI proof. In the future some of these properties might be producing data that could be aggregated into an analysis of test vs. control groups.
Anecdotally the reception given was extraordinarily positive. The number of cases was small and yet enough studios and networks became interested in Value Signals as a way of penetrating to the next level of the game, such that the news went viral within the community. Not only did creatives like the input, it agreed with some of the things they had been thinking but hesitating to bring forth. It was found that the feedback could also be used by studios in pitching to networks, “a new vocabulary to upgrade the stories” was how one wise person put it.
Future
The ScreenSavants Vision is to create a machine learning system inspired by Watson. Humans will continue to apply tags to shows, however, so will robots. Seven different robotic methods are described in the RMT patent. The human and robot inputs will be separately and continuously measured and given a weight by Adjusted R Squared against ratings, box office, and in the case of the recommender application, applause:boo ratio and loyal conversion rate to recommended programs. The weights will be optimized to maximize the prediction.
Creatives will be able to start to get feedback from the artificial intelligence (AI) as soon as they can start to key in their first notes.
RMT is in discussions with technology and media companies about partnering to bring this about in the most expeditious way. Value Signals promise to add a level of understanding of process that can help increase success rates in the creation of new screen content. With screen content consumption time exceeding everything but sleep in some cases, this is an important area in which to increase effectiveness and efficiency, but cannot be allowed to slow down creatives, the process at all times must be alert to creatives as the prime users.
References
1 These statistics derived from Variety compilations, one author’s own 10-year track record compilation, inputs from Melva Benoit, and conversations with leading program researchers.
2 ARF Adworks I study, compilation of IRI BScan tests. Please contact authors for details.
3 Harvey and Larguinat, “The New Research is Bringing Transparency Between Marketing and Finance”, ARF AM 2011.
4 Metzger, https://www.mediavillage.com/article/in-terms-of-roi-what-do-we-know- about-todays-tv-ratings-currency-bill-harvey-mediabizbloggers/