
Quantifying the ROI Impact of the Value Signals* Context Resonance

Final Full Report of First ARF “How Advertising Works” Context ROI Case Study – Bill Harvey, RMT and Howard Shimmel, Turner
October 2, 2017
Abstract:
- As part of the ARF HAW program, RMT, Research Measurement Technologies, was invited to contribute ROI findings on how Value Signals* could be used to match ads with programs for maximum priming effect.
- Howard Shimmel of Turner, who sponsored the work, was actually the one to devise the design. Turner had conducted many studies with Nielsen Catalina Solutions (NCS) to measure ROI of specific campaigns. His idea was to take some of this past work, have RMT score how well each ad placement lined up the same Value Signals in both ad and program, and he did parallel work with LEAP and Nielsen QUAD which did not score the context/ad resonance but rather quantified the emotional attachment or viewer loyalty of the context. In this way by having NCS then break out the ROI by these context dimensions one would see potentially how much lift in ROI could be achieved by shifts in buying to take advantage of context dimensions.
- The result showed that across the 15 ads tested, if all GRPs could be equally allocated across the top four deciles of Value Signals Resonance between ad and program, the ROI would be lifted an average of +36%. LEAP could lift ROI +10% if all placements were in top tertile of LEAP scores, while QUAD was not uniformly predictive of increased ROI.
I. Background
Although it is widely recognized in the psychological literature and even in the annals of media research, that the context of a message influences the reception of that message, only a few practitioners regularly optimize in this dimension across entire campaigns1. This is due to the practical difficulties involved and the lack of strongly validated data by which to code and match ad and environment. This situation has been fundamentally altered by the validation of Value Signals as predictive of specific program viewing2. These 265 words or phrases can be associated with an ad and with a program thereby making it possible to activate context resonance. This capability has never existed before.
Turner has been especially interested in the context dimension and has sponsored a number of studies to measure its effects3. Uniquely Turner coded all of the movies in its extensive library so as to identify places to cut to commercial whereby the context of the movie would lead directly into a perfect opportunity for some specific product category to be advertised4.
The ARF since in 2016 re-establishing its Adworks project that had been providing landmark guidance in the 1990s, now called How Advertising Works (HAW), has come to be increasingly interested in the context dimension5. This is because with the vast upswing in programmatic buying in digital, and the popularization of the notion of buying audiences rather than programs, and the overweening focus on targeting, all other dimensions have gone to the back of the bus. This has led to under-investment in premium environments such as prime time television in favor of context-neutral buying approaches which have been shown by SMI and others to have reduced ROI for many brands6.
Accordingly when ARF became aware of Value Signals in 2015 (when ARF provided main stage time to present Value Signals for the first time) they began to think about how this new method of quantifying creative (ad and program) could contribute to redressing the issue of the importance of context7. Upon ARF invitation RMT and Turner collaborated to conduct this study powered by NCS as the third party measurement platform for ROI.
II. Objectives
ARF EVP Horst Stipp points out a significant difference between other approaches to context and Value Signals. All other approaches to context have been based on the idea of matching ads and programs on one single dimension, although that single dimension varied from one practitioner/case to another. Food in food shows, happy ads in happy shows, etc. By stark contrast, Value Signals match ad and context based on 265 dimensions, thus represent the first multidimensional matching of ad and contexts. The primary objective of this study was to gauge the degree to which ROI could be lifted if a brand were to apply this multidimensional approach as regards matching its particular ad to specific program contexts.
The secondary objective was to assess at least three alternative (or combinable) ways of quantifying context: Value Signals (which matches specific ads to specific programs multidimensionally), LEAP and QUAD (both of which are unidimensional and quantify the emotional/loyalty/attentional power of specific programs regardless of the ad creative). Because as ARF EVP Horst Stipp has pointed out, these are two separate approaches to the context dimension (ad-specific and ad-nonspecific), the practitioner can use both together if that is what the data findings support.8
The tertiary objective was to glean an understanding of how well the context dimension might be already optimized “accidentally” by today’s normative buying practices.
III. Method
- Turner provided RMT with 15 ads that had run across many networks and programs in the third quarter of 2016.
- RMT appended Value Signals to each (Three RMT coders independently tag the program and where two out of three or more agree the tag is accepted.)
- RMT had already placed Value Signals on most of the programs in which these ads had been placed in 3Q16, and for this study placed DriverTags on the remaining programs carrying any of these ads in that quarter. 721 programs were in this group.
- For each actual placement, RMT calculated the percent of the ad’s Value Signals that were also in the program, dubbing this the “Context Resonance Score”.
- LEAP and QUAD scoring for the same placements rated each placement as High Medium or Low by Turner.
- NCS presented back the ROI findings for each decile of Value Signals Context Resonance, and for High Medium Low LEAP and QUAD.
- RMT also scored the non-placements i.e. the placements that could have been made but were not made in the list of programs that carried any of these ads in that quarter.
- RMT by studying the decile data realized that the top four deciles e. Resonance Scores of 60%+ were where the ROI lift occurred and averaged these four deciles together on an unweighted basis. This answers the primary objective of the study, i.e. to determine what the ROI lift would be if the buyer were to do everything right.
- NCS pointed out that the GRPs across those deciles were not equal and so the ROIs in those deciles needed to be weighted by the GRPs in order to report accurately what the actual ROI lift contribution was in the case of those 15 ads in that Because the GRPs tended to be skewed to lower Resonance Scoring programs, the ROI lift that had been caused by the good luck of having some higher Resonance Scores was not as great as it can be in the future if the buyer is buying with Resonance as one of the factors in the optimization equation.
Obviously with Value Signals, this context leveraging method lends itself well to programmatic buying as well as conventional buying and use of optimizers.
IV. Findings
- As expected, luck did not supervene to provide accidentally good matches between ads and programs to any significant degree.
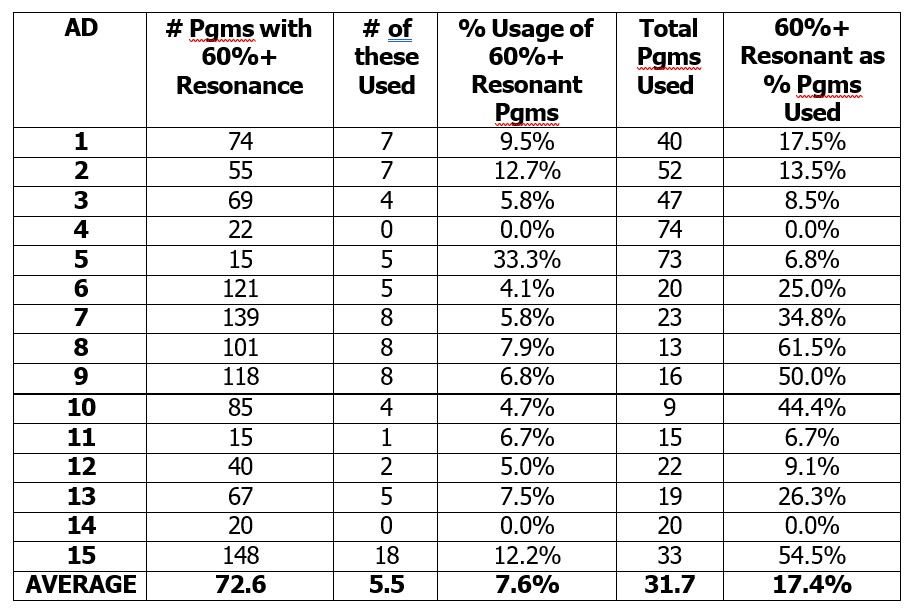
- On average, of the total of 721 programs used by one or more of these ads in the quarter studied, the average of these ads appeared in about 32 programs, of which only 5 or 6 were in the 60%+ Resonance range.
- Looked at another way, the average ad had about 73 programs for which their ad was at least 60% Resonant, out of which the average ad only used 7 to 8 percent of those High Resonance opportunities.
- The luck was unevenly Some ads had zero usage of the 60%+ Resonant programs for their ad, while one ad used a third of its 60%+ Resonance opportunities.
- Looked at another way, while a couple of ads allocated 0% of their placements to 60%+ Resonant programs, one ad had the great luck of 61.5% of its placements being in such programs. The average ad had 17.4% of its placements in programs which were 60%+ Resonant with the ad. Ideally that 17.4% would be closer to 100%, bounded only by cost, reach, and targeting constraints. In the latter regard it is worth noting that even within this list of 721 programs the average ad had 60%+ Resonance with an average of 73 programs and one ad had 148 programs of 60%+ Resonance with the Therefore there shall probably be a sufficient number of programs with high Resonance such that crossing that with cost and targeting constraints one should still be able to buy across enough different programs to attain high reach.

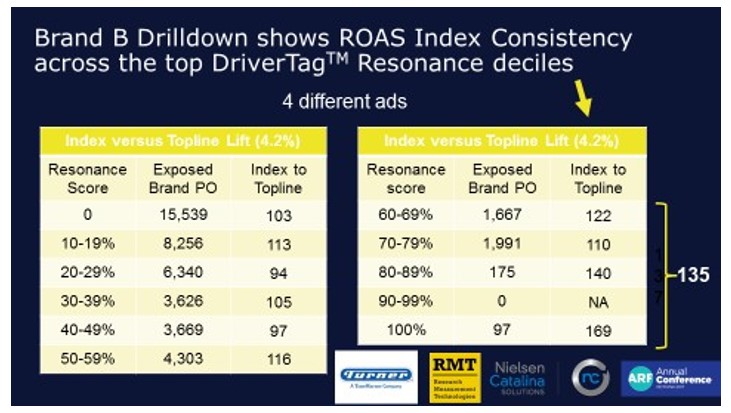
- Nielsen provided the following tables which are shown here, with text added by RMT outside the tables. Note that for this brand with its 11 ads, our straight average across the non-empty cells in the top 4 deciles is 137 ROI index on the total brand campaign ROI. This assumes equal GRP weight given to each decile in a projected future scenario. Of course, an even more desirable scenario would be to skew the GRPs to the highest deciles. In the third quarter of 2016 when these ads actually ran the skew across these deciles was in the undesirable direction and Nielsen has advised us that the actual ROI index achieved was reduced to 128 as result of this GRP skew. This illustrates that the current state of the art in which context is ignored but one hopes for luck is too uncontrolled a process upon which to base media selection. (Note: “PO” means Purchase Opportunities, i.e. the number of observations of a person being in the store which is a sample size measure in NCS.)

- Nielsen provided these tables and again the straight average we calculated of 135 index assumes that going forward the practitioner will strive to put as close to 100% of placements into the top four Resonance deciles with at least an even distribution if not skewed to the upper deciles. Again Nielsen indicates that because the brand’s GRPs in the top four deciles were skew in the downward direction the actual ROI index that brand achieved in 3Q16 was 118.

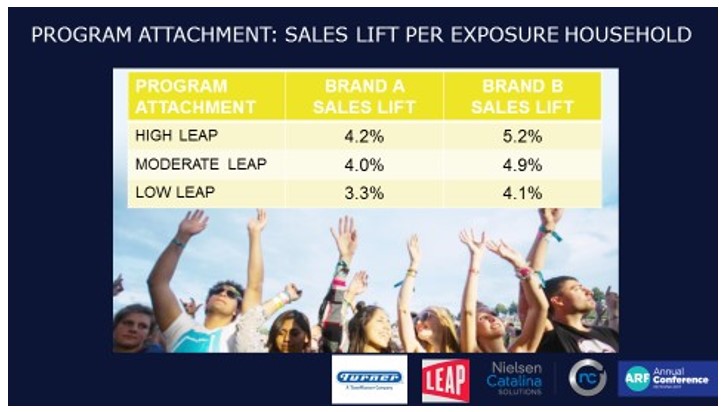
- Turner supplied this slide using the NCS data provided on LEAP. The straight average of Brand A sales lift was 3.83 and using it as the base the High LEAP category was an index of 7. For Brand B this was 4.73 average sales lift and High LEAP index of 109.9.

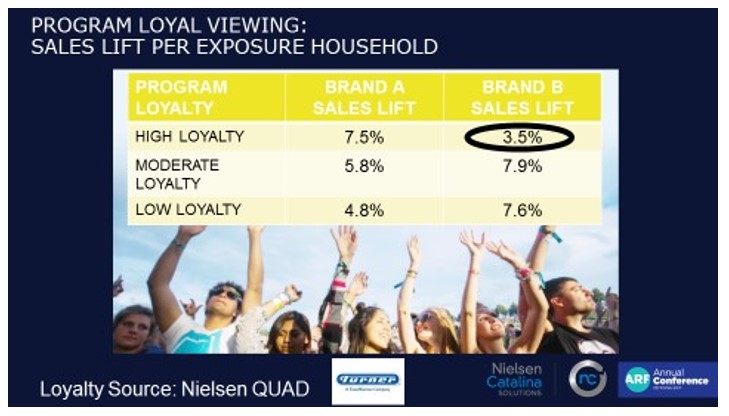
- Turner also provided these NCS findings. Here the QUAD GOLD loyalty metric was less internally consistent in its For Brand A High Loyalty the sales lift index was 124.4 calculated in the same way as above for LEAP. For Brand B, the sales lift index was 55.3, in other words High Loyalty programs delivered lower sales lift than Moderate Loyalty and Low Loyalty programs. This would seem to suggest that there is no point in optimizing on the use of programs with high loyalty. The matching of content approach via Value Signals would appear to be more of a causal driver of ad performance than program loyalty.

V. Conclusions & Recommendations
- As expected based on the psychological literature, the matching of ads to programs based on Value Signals encompassing all psychological words proven to be highly correlated with Nielsen ratings and with conversion to recommended programs leads to a substantial ROI lift effect. The average effect observed accidentally in schedules not optimized for Resonance is +23% ROI lift (average of 18% and 28%) because even in the placements with at least 60% overlap between the program’s Value Signals with the ad’s Value Signals, the distribution of GRPs is gravitated downward toward the bottom in terms of Resonance. In other words, even though an ad may have a sixth of its placements in the 60%+ Resonance category, it may only have an eighth of its impressions there, and even within that valued category, the GRPs may sag to its bottom. The average going-forward predicted effect is +36% sales lift based on the intention of having even distribution of GRPs and as many of them as high as possible in Resonance, where 60%+ is the inflection point that establishes the minimum desirable level.
- Optimization combining this dimension with reach against ROI-Driving purchaser/psychographic targets at lowest cost should be considered the best practice. Based on average ROI lifts in the 28-40% range by leading practitioners of purchaser targeting (TRA, Apollo, NCS, et al, assuming a normal percentage of rotations) this additional +35% lift roughly doubles the sales effect of purchaser targeting, the last great leap forward9.
- Additional ROI lift can logically be achieved by using Value Signals to determine what the ad content should be, based on the Value Signals “watched on television” by the purchaser/psychographic target10.
- Additional ROI lift can logically be achieved by using Value Signals to characterize each household and person whose tuning/viewing is known from a panel or STB data Then an optimizer can in selecting a program determine that for its cost it delivers not only the most reach against the target but also the most Resonance between ad and program and the homes/individuals reached10. The latter three-way Resonance among ad, program, and audience member can also be used experimentally in multitouch attribution and singlesource models to predict which exposures probably had the most sales impact. If this improves the fit with the sales data it would suggest that it is a valid best practice going forward.
VI. References
1Harvey, “The Effect of Program Environment on Commercial Communication”, Interpublic Blue Book Report, 1964; this was an early study on context but not the earliest, as the subject has been evergreen since the 19th Century inception of special interest publications. As ARF EVP Horst Stipp points out, the industry considers that it pays adequate attention to the context dimension because each year a certain portion of the budget is placed so as to judgmentally increase positive context effects, typically in expensive sports and/or other special programming such as Olympics, Superbowl, Oscars and other award shows, etc. This paper and study is based on the hypothesis that for maximum ROI, context needs to be considered for each ad placement
2 Harvey and Mu, “The Next Frontier: Content Analytics”, ARF AMS 2015
3 https://www.innosight.com/client_impact_story/turner-broadcasting
4 Elliott, “Turner to Offer Marketers Way to Link Ads to Content”, The New York Times, May 15, 2008 http://www.nytimes.com/2008/05/15/business/media/15turner.html
5 Stipp and Bacon, “ARF Original Research: How Advertising Works 2016-2017; Unveiling the ARF Context Effects Model & ROI”, ARF Re:THINK 2017; This study was the only case presented involving ROI
6 Fennessy, Federov and Harvey, “Empower Brands with Actionable Insights Via Syndicated ROI Tracking Reports”, ARF Re:THINK 2017
7 Harvey and Mu, op. cit.
8 Stipp, op. cit.
9 Pellegrini and Harvey, “Improve Ad Effectiveness Through Psychological Triggers”, ARF Re:THINK 2017
10 Pellegrini and Hutton, “Empowering ROI by Connecting Psychographics and Programmatic”, ARF AMS 2017
*NOTE: Value Signals were previously known as DriverTags.